
When you think of Microsoft’s Power BI you probably think about the attractive visualizations, but the tool’s biggest flex is it lets you create a mini data warehouse right in the desktop app. If you are working in a large company with a well-developed data strategy this may not be necessary, but if you work in a small to medium sized organization with siloed data in everything from Excel to Salesforce this is going to be a gamechanger.
Why Create a data model?
The easy answer is that it is a must. Any data you bring into Power BI will comprise the data set for your report. So, whether you create a large, flat table, relational style model, or use the star schema you are “modeling” the data. It is a possibility that you will have a large flat table in excel to dump into Power BI, but chances are the process you are trying to report on happens in multiple systems or is recorded in *shudder* multiple spreadsheets. It would be inefficient to extract all this data and create a single table. Also, if your reporting requirements expand it could make the table unwieldy, and updates could be error prone. Creating a fully normalized database within Power BI could make your data model difficult to use and unnecessarily slow. Instead, it is recommended that you design your data model as a star schema.
What is the Star Schema?
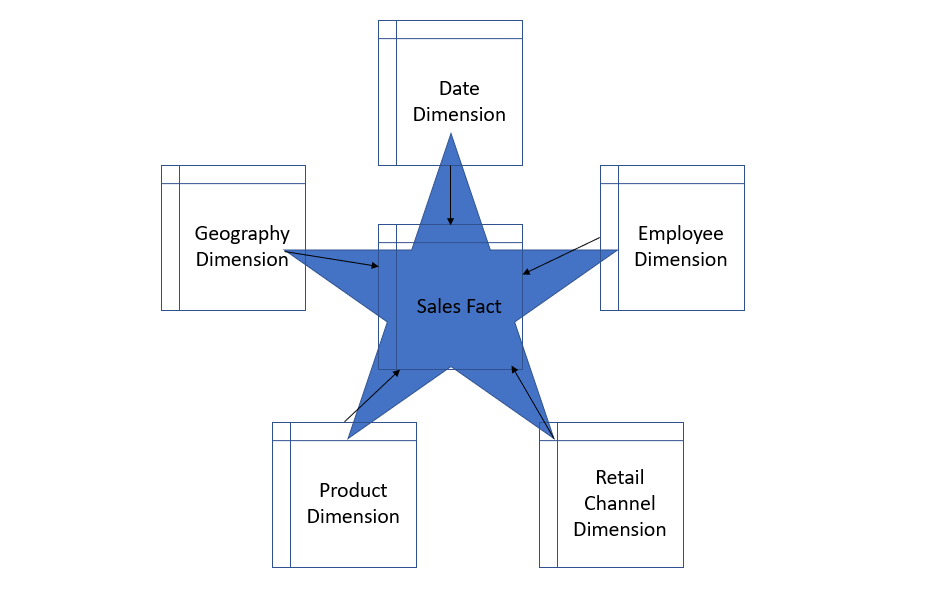
The star schema is a simple dimensional design that separates business process data into facts, measurable quantitative data, and dimensions, which are the descriptive attributes of the fact data. A star schema gets its name from the way the model looks, essentially a fact table in the center connected to its surrounding dimensions representing the star’s points.
Fact tables are generally long (lots of rows) and narrow (few columns) while dimensions are wide and short. Facts need to be uniform in their level of detail, or grain. This could mean that a sales table could contain daily sales transactions, or monthly, the choice depends on the business, so long as every row in the table represents the same grain. Dimensions can include employee tables, date tables, or geography tables. These are the categories that are reported on. Think of these as the “by” tables. As in, “Sales by Employee”, “Sales by City”, or “Sales by Quarter”. Fact tables contain foreign key attributes that are primary keys in the dimension tables.
Why Star Schema?
Star schemas are one of the simplest forms of dimensional design. This schema reduces the number of joins needed to query your data, which makes reporting faster and easier. The logic is simplified to make normal business reporting tasks like period over period and period to date easier. This is also the model style expected by Excel’s Power Query. This makes the data model totally reusable across the organization whether you are using Excel or Power BI.
What Next?
This is a pretty simple overview of how and why to create a solid, star schema data model when using Power BI. These same principles extend to other data warehouse products. To get more information I recommend checking out these sources:
